Cause and effect diagrams strength visually organizes information. The problem statement is identified when there are 3 to 6 causes of categories for example, people, methods, materials, measurement, and problem. Developing categories and identifying possible causes with each is a benefit of the fishbone or Ishikawa diagram. The cause and effect diagram will help visually display the many potential causes for a problem or effect.
When utilizing a team approach to problem solving, there are often many opinions as to the problem’s root cause. One way to capture these different ideas and stimulate the team’s brainstorming on root causes is the cause and effect diagram. The fishbone will help to visually display the many potential causes for a specific problem or effect. It is particularly useful in a group setting and for situations in which little quantitative data is available for analysis.
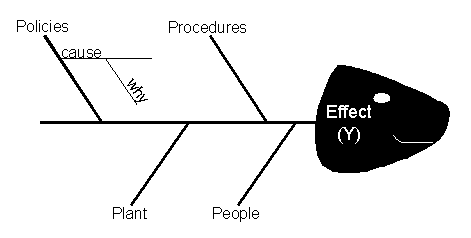
To construct a fishbone, start with stating the problem in the form of a question, such as ‘Why?’ Framing it as a ‘why’ question will help in brainstorming, as each root cause idea should answer the question. The team should agree on the statement of the problem and then place this question in a box at the ‘head’ of the fishbone.
The rest of the fishbone then consists of one line drawn across the page, attached to the problem statement, and several lines, or ‘bones,’ coming out vertically from the main line. These branches are labeled with different categories. The categories you use are up to you to decide. There are a few standard choices:
Table 1: Fishbone Suggested Categories
|
Service Industries
(The 4 Ps)
|
Manufacturing Industries
(The 6 Ms)
|
Process Steps
(for example)
|
-
Policies
-
Procedures
-
People
-
Plant/Technology
|
-
Machines
-
Methods
-
Materials
-
Measurements
-
Mother Nature
(Environment)
-
Manpower
(People)
|
-
Determine Customers
-
Advertise Product
-
Incentive purchase
-
Sell Product
-
Ship Product
-
Provide upgrades
|
Once the branches labeled, begin brainstorming possible causes and attach them to the appropriate branches. For each cause identified, continue to ask ‘why does that happen?’ and attach that information as another bone of the category branch.
Figure 1: Fishbone Diagram Example
Once the fishbone completed, it helps in understanding the root causes of your problem.
Ishikawa diagrams (also called fishbone diagrams, or herringbone diagrams , cause-and-effect diagrams, or Fishikawa) was created by Kaoru Ishikawa (1968). Common uses of the Ishikawa diagram are product design and quality defect prevention, to identify potential factors causing an overall effect. Each cause or reason for imperfection is a source of variation. Causes are usually grouped into major categories to identify these sources of variation. The categories typically include:
-
People: Anyone involved with the process
-
Methods: How the process is performed and the specific requirements for doing it, such as policies, procedures, rules, regulations and laws
-
Machines: Any equipment, computers, tools etc. required to accomplish the job
-
Materials: Raw materials, parts, pens, paper, etc. used to produce the final product
-
Measurements: Data generated from the process that are used to evaluate its quality
-
Environment: The conditions, such as location, time, temperature, and culture in which the process operates
Overview


Ishikawa diagram, in fishbone shape, showing factors of Equipment, Process, People, Materials, Environment and Management, all affecting the overall problem. Smaller arrows connect the sub-causes to major causes.
How do I use/create a fishbone diagram?
1. Specifically state the problem. Be as specific as possible. Write the problem statement at the head of the fishbone or as the back bone of the fishbone.
2. Define the major categories. There are some standards that can be used such as "the 6Ms" or "the 4Ss" (Suppliers, Surrounding, Systems, and Skills)
3. Conduct a brainstorming session for more detailed causes and fill out the diagram or table.
4. Review the completed diagram. Eliminate causes that do not belong. Brainstorm for more causes in categories that have fewer causes identified
5. Discuss the diagram as a group (this can be done at a later date as well). Determine which causes the group feels need further investigation.
6. Mark the causes that will be followed up on in order to assist with tracking. This is where the additional columns will come in handy in the template
7. DO NOT CREATE ACTION PLANS until the causes have been confirmed through research and data analysis.
What exactly is a fishbone diagram?
A fishbone diagram, cause and effect chart, Ishikawa diagram, etc is used to analyze relationships between problems and their causes. It combines brainstorming with systemic analysis. The name Ishikawa diagram comes from the person who invented the process The process/tool is used to identify the many causes of a problem and group them together in some logical order.
Purpose
1. To assist with uncovering root cause
2. To generate and group problem causes
3. Systematically evaluate the causes and assist with determining the most likely root cause
When should I use a fishbone diagram?
A fishbone diagram is best used once the Problem statement is clearly defined. The tool can also be used as a cause prevention mechanism by brainstorming ideas to prevent future problems or maintain current state.
References:
http://scorecardanalysis.blogspot.com/2010/08/fishbone-ishikawa-diagram-template.html
http://en.wikipedia.org/wiki/Ishikawa_diagram

Comments (0)
You don't have permission to comment on this page.